![Clear["Global`*"] ; buildDCT[i_, data_, c_] := Module[{L = Length[data]}, & ... 0, arg3] c〚n + 1〛 dct〚n + 1〛 Cos[((2i + 1) n π)/(2 L)] ]](HTMLFiles/index_1.gif)
HW 2, EECS 207A. Fall 2004. UCI.
First problem.
by Nasser Abbasi
Problem
The following table displays the pixel intensity values of a macro block of a 1-dimensional image
60, 75, 86, 200, 235, 255, 46, 34
a) compute the DCT coefficients of this function.
b) compute the original function from the DCT using the IDCT algorithm
c)Ignore the last 4 bytes and recompute the original function, how much error is introduced?
extra work: I also did an edditional analysis on this problem. I showed how the error in data changes as a function of number of terms dropped from the DCT table
Part(a)
Define the DCT and IDCT functions
In[923]:=
![Clear["Global`*"] ; buildDCT[i_, data_, c_] := Module[{L = Length[data]}, & ... 0, arg3] c〚n + 1〛 dct〚n + 1〛 Cos[((2i + 1) n π)/(2 L)] ]](HTMLFiles/index_1.gif)
Define the data and create the C table
In[1005]:=
![(*originalData = {128, 88, 40, 0, 0, 40, 88, 128} ; *)(*originalData = ... ength[originalData] ; c = Table[2/L^(1/2), {L}] ; c〚1〛 = 1/L^(1/2) ;](HTMLFiles/index_2.gif)
Create the DCT values, and print them
In[1009]:=
![dct = Table[buildDCT[i, originalData, c], {i, 0, L - 1}] ; Print["DCT values = ", Ta ... e= ", TableForm[N[c], TableDirections-> {Row, Column}, TableSpacing-> {1, 6}]]](HTMLFiles/index_3.gif)
![]()
![]()
![]()
Part(b)
Use IDCT to recompute the original data, i.e. use all DCT points.
In[1013]:=
![endIndex = Length[dct] - 1 ; dataNew = Table[buildIDCT[i, dct, c, endIndex], {i, 0, L - 1}] ; ... quot;, TableForm[Chop[N[dataNew]], TableDirections-> {Row, Column}, TableSpacing-> {1, 6}]]](HTMLFiles/index_7.gif)
![]()
Part(c)
In[1016]:=
![bytesToIgnore = 4 ; endIndex = Length[dct] - bytesToIgnore - 1 ; dataNewShort = Table[buildIDC ... eForm[ N[Abs[error]/dataNew 100] , TableDirections-> {Row, Column}, TableSpacing-> {1, 6}]]](HTMLFiles/index_9.gif)
![]()
![]()
![]()
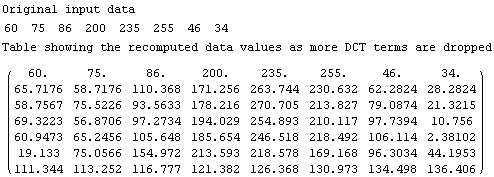
Extra work. Generate table showing how much error (in percentage) in the data recomputed as we drop more terms in the DCT. Try from 1 to 7 terms dropped.
In[1023]:=
![L = Length[dct] ; data = Table[i, {i, 1, L - 1}, {j, 1, L}] ; For[n = ... ll〛 = Table[buildIDCT[i, dct, c, endIndex], {i, 0, Length[dct] - 1 }] ; } ]](HTMLFiles/index_13.gif)
Data recomputed, each row shows the data based on dropping as many terms from DCT as the row number-1.
For example, the first row shows the data recomputed if we dropped ZERO terms from DCT.
The second row shows the data recomputed if dropped ONE term from DCT, etc...
In[1130]:=
![Print["Original input data\n", TableForm[originalData, TableDirections-> {Row, Co ... es as more DCT terms are dropped\n"MatrixForm[Chop[N[data〚All, All〛]]]]](HTMLFiles/index_14.gif)

In[1144]:=
![RowBox[{(* now compute the error in % *), , RowBox[{error = Table[i, {i, 1, L - 1}, {j ... ity}], ]}]}], ;}], , Show[{g1, g2}, DisplayFunction$DisplayFunction], }]}]](HTMLFiles/index_16.gif)

![Average error in data as more DCT terms are dropped ] ... 100.01470799432798`](HTMLFiles/index_18.gif)
![[Graphics:HTMLFiles/index_19.gif]](HTMLFiles/index_19.gif)
Out[1152]=
![]()
![[Graphics:HTMLFiles/index_21.gif]](HTMLFiles/index_21.gif)
Out[1155]=
![]()
Conclusion
The Max error in the recomputed data array increases as more DCT terms are dropped. But that is not always true each time. In this example, as we dropped the 6th term in the DCT table, the max error was actually smaller, but we see that the average error in data is always increasing as expected. I am not sure now why the max error in data did not go down every time we dropped an additional term from the DCT. This needs more investigation. I have tried this on another data input and saw the same result.
Created by Mathematica (October 21, 2004)