HW2, MAE 200A. Fall 2005. UCI
Nasser Abbasi
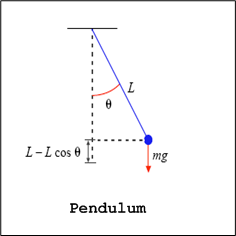
Given this simple pendulum, plot the constant energy curves in
Answer
The constant energy curves are curves in the Y-X plane where energy is
constant. The Y-axis represents
 ,
and the X-axis represents
,
and the X-axis represents

We are told to assume there is no damping.
We assume the pendulum is given an initial force when in the initial position
( )
that will cause it to swing anticlock wise. The pendulum will from this point
obtain an energy which will remain constant. The higher the energy the
pendulum posses, the larger the angle
)
that will cause it to swing anticlock wise. The pendulum will from this point
obtain an energy which will remain constant. The higher the energy the
pendulum posses, the larger the angle
 it will swing by will be. If the energy is large enough to cause the pendulum
to reach
it will swing by will be. If the energy is large enough to cause the pendulum
to reach
 (i.e. upright position) with an non zero angular velocity, then the pendulum
will swing continue to rotate in the same direction and will not swing back
and forth.
(i.e. upright position) with an non zero angular velocity, then the pendulum
will swing continue to rotate in the same direction and will not swing back
and forth.
To be able to solve this, I therefore need to find the range of angle the pendulum will swing for a given energy level. And for this range of angle determine the angular speed, this will give me the required phase plot.
I will first derive the expression for the energy
 for the pendulum above, which will be a function of

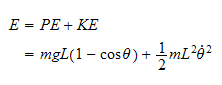
Hence
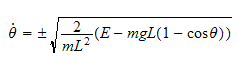
For
 to be real,
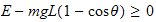 ,
hence
,
hence
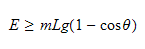

So, for
 ,
,

For
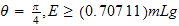
For
For
For
The above means that for energy level
 for example, the angle range to plot the constant energy curve for will be
between
for example, the angle range to plot the constant energy curve for will be
between

So, For each energy level, I will generate a plot for all the angles up to the
angle limit allowed by that energy level. For each angle, I will find
 from equation (1)
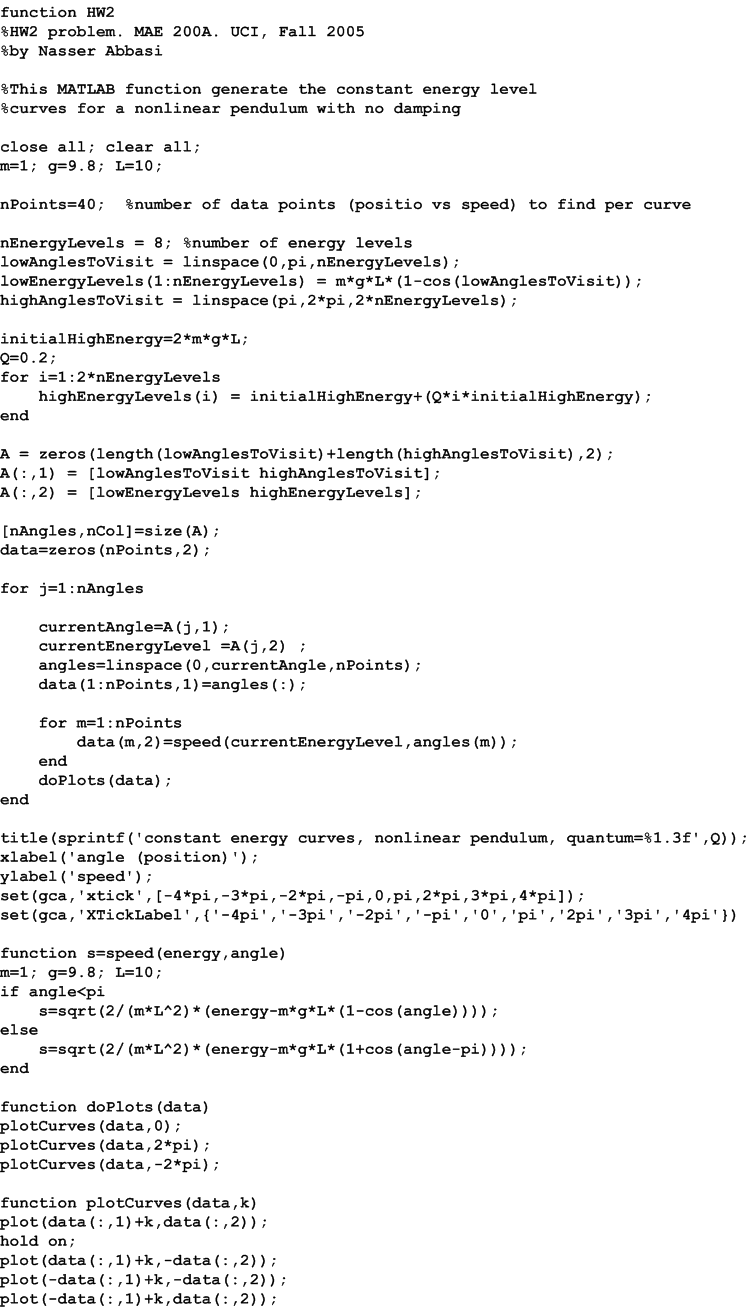
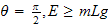
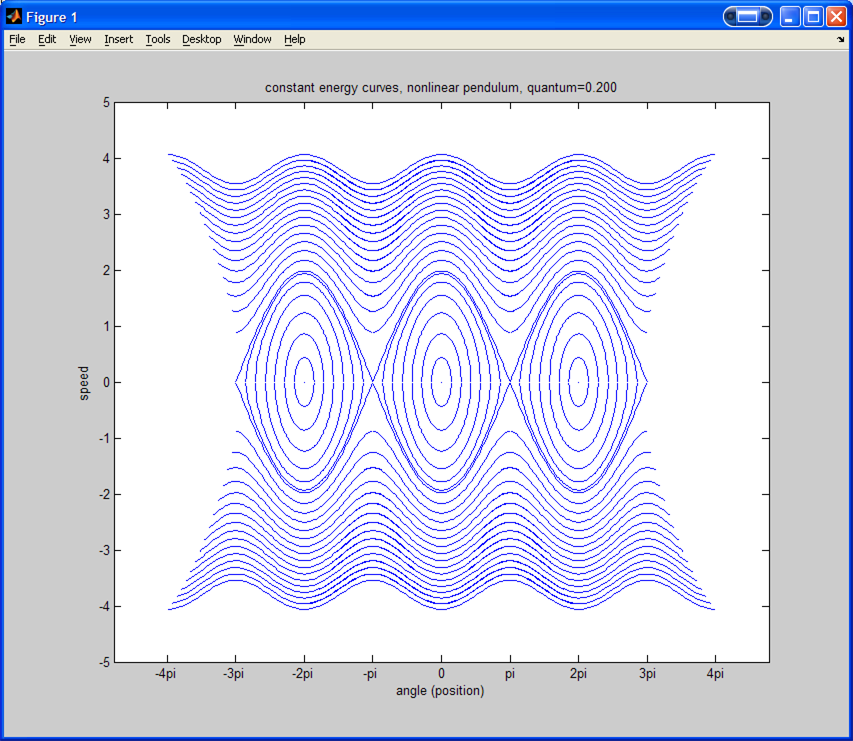
The following is the resulting plot and below that is the program I wrote to
generate this plot. This was done for
I show different plots for different granuality in the energy levels. Different quantum is used for different plots.
By the quantum I mean that the energy levels for the escape energy will change from its lower level by this quantum factor. So, for a quantum of 1/2 for example, this means the energy is being incremented for each level by an amount which 1/2 the previuse energy level.
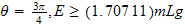
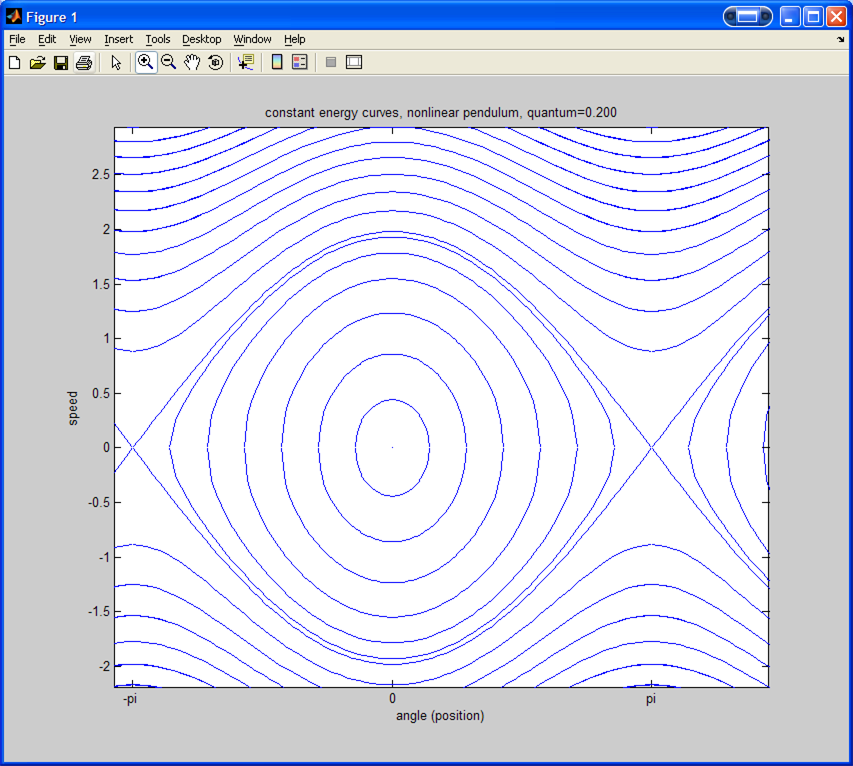
This is a zoom to a smaller area to better show the energy lines
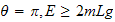
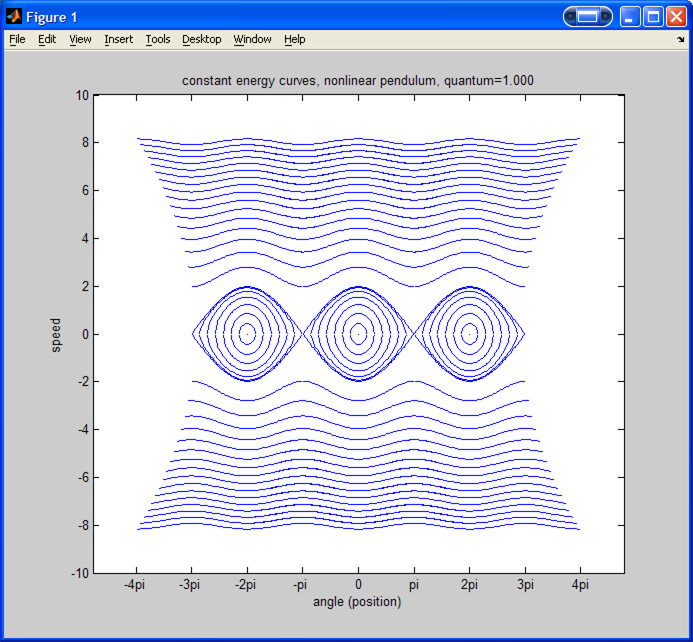
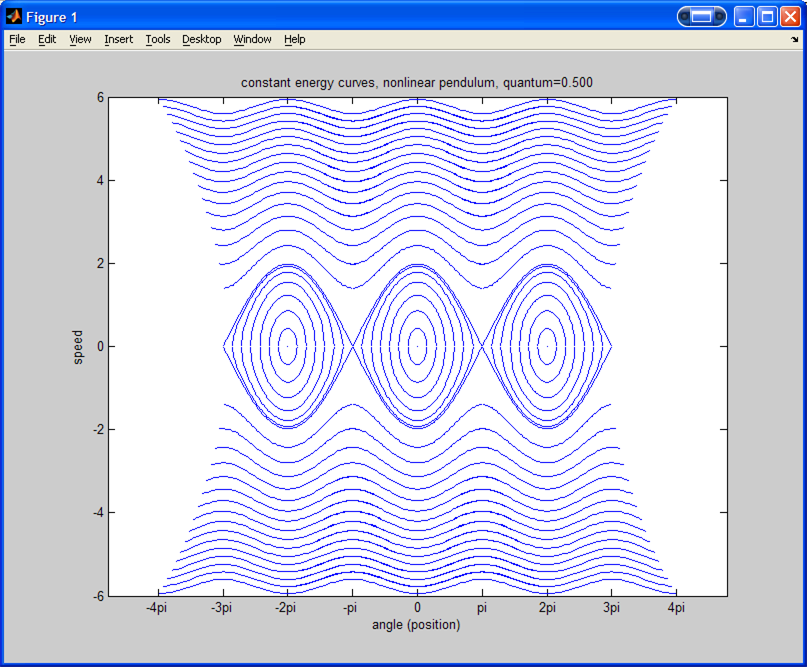
This
below is a plot using different quantum
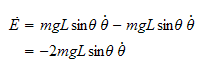
If we need to calculate the equilibrium points, we can do find the rate of change of the energy, and set that to zero as follows
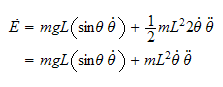
substitue into the above the following system dynaics equation
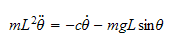
We are told to set
 ,
hence the equation becomes
,
hence the equation becomes
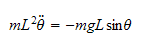 so we get
For
 means
means
 or
or