OUTPUT: The following is the output of running the
program nma_euler_heun2. This program implements the predictor-corrector
algorithm. It will display the final plot comparing the heun method to the true
solution. It also prints a detailed table showing the progress at each step in
the iteration. Description of the table generated is as follows: There are 12
columns in the table:
n x y0
y0' yp yp' yc y_c'
y_av' yt
y'_t err(a)
The first column is n, which is the iteration
number.
Second column is x, which is the x-value at
start of the step.
Third column is y0, which is the y-value at
the start of the step. For the first step, the initial condition is used.
4th column is y0’, which is the
slop at the start of the step.
5th column is yp, which is the
predicted value of y at end of step.
6th column is yp’, which is the
slope at yp.
7th column is y_c, which is the
corrected y at end of the step.
8th column is y_c’, which is the
slope at the corrected y.
9th column is yt, which is the
true y value at end of the step.
10th column is err(a), which is
epsilon(a).
note, for the slopes (rate or derivative), I print
the angle in degrees. This is to make it easy for me to see what is going on.
>> nma_euler_heun2('exp(x*(x^2/3 -
1.2))','y*(x^2-1.2)',0.5,0,2.0,1,1)
n x y0 y0' yp
yp' yc y_c'
y_av' yt
y'_t err(a)
1 0.00 1.00 -50.19 0.40 -20.81 0.64 -31.43 -35.50 0.57 -28.53 37.83
2 0.00 1.00 -50.19 0.64 -31.43 0.57 -28.36 -40.81 0.57 -28.53 13.22
3 0.00 1.00 -50.19 0.57 -28.36 0.59 -29.32 -39.28 0.57 -28.53 3.87
4 0.00 1.00 -50.19 0.59 -29.32 0.58 -29.02 -39.76 0.57 -28.53 1.20
5 0.00 1.00 -50.19 0.58 -29.02 0.59 -29.11 -39.61 0.57 -28.53 0.37
6 0.50 0.59 -29.11 0.31 -3.52 0.44 -5.03 -16.32 0.42 -4.81 30.03
7 0.50 0.59 -29.11 0.44 -5.03 0.43 -4.95 -17.07 0.42 -4.81 1.65
8 0.50 0.59 -29.11 0.43 -4.95 0.43 -4.95 -17.03 0.42 -4.81 0.09
9 1.00 0.43 -4.95 0.39 22.26 0.51 28.13 8.65 0.51 28.13 23.45
10 1.00 0.43 -4.95 0.51 28.13 0.54 29.35 11.59 0.51 28.13 4.94
11 1.00 0.43 -4.95 0.54 29.35 0.54 29.61 12.20 0.51 28.13 1.03
12 1.00 0.43 -4.95 0.54 29.61 0.54 29.66 12.33 0.51 28.13 0.21
13 1.50 0.54 29.66 0.83 66.64 1.10 72.02 48.15 1.31 74.70 24.85
14 1.50 0.54 29.66 1.10 72.02 1.16 72.84 50.84 1.31 74.70 4.81
15 1.50 0.54 29.66 1.16 72.84 1.17 72.96 51.25 1.31 74.70 0.77
16 2.00 1.17 1.17
1.31 74.70
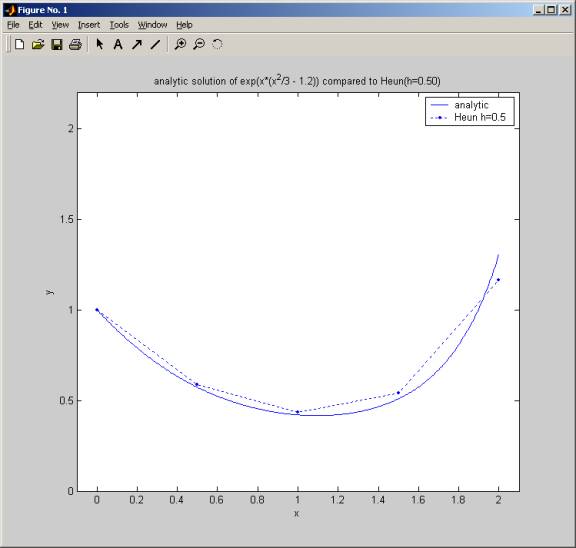
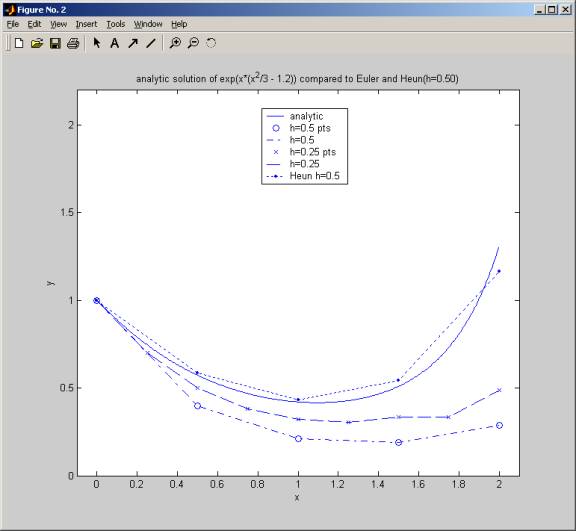
This below is a plot
to compare heun method to Euler method. This plot shows that Heun method for
h=0.5 does even a better solution that Euler for h=0.25.
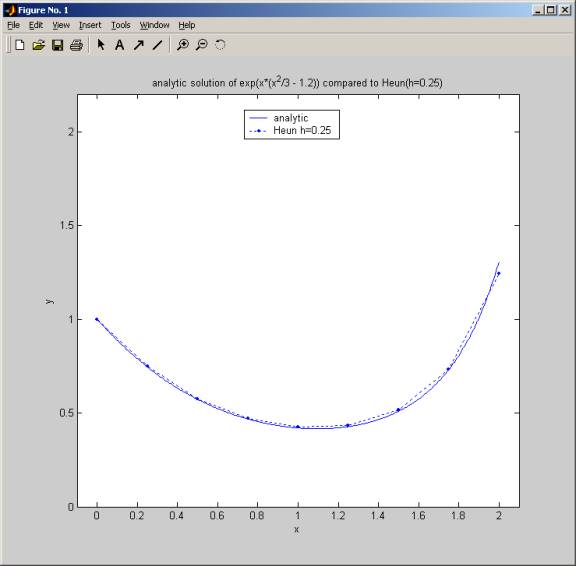
Even though now
required to do, The following is a run of the program for heun method again but
for h=0.25. This shows that it took less iterative steps to reach the required
tolerance error. This is expected ofcourse. The final plot shows an excellent y
solution for heun method with h=0.25 compared to the true solution:
>> nma_euler_heun2('exp(x*(x^2/3 -
1.2))','y*(x^2-1.2)',0.25,0,2.0,1,1)
n x y0
y0' yp
yp' yc
y_c' y_av' yt y'_t err(a)
1 0.00 1.00 -50.19 0.70 -38.53 0.76 -40.68 -44.36 0.74 -40.27 7.35
2 0.00 1.00 -50.19 0.76 -40.68 0.75 -40.32 -45.43 0.74 -40.27 1.25
3 0.00 1.00 -50.19 0.75 -40.32 0.75 -40.38 -45.26 0.74 -40.27 0.21
4 0.25 0.75 -40.38 0.54 -26.95 0.58 -28.91 -33.66 0.57 -28.53 7.94
5 0.25 0.75 -40.38 0.58 -28.91 0.57 -28.64 -34.64 0.57 -28.53 1.09
6 0.25 0.75 -40.38 0.57 -28.64 0.58 -28.68 -34.51 0.57 -28.53 0.15
7 0.50 0.58 -28.68 0.44 -15.64 0.47 -16.81 -22.16 0.47 -16.61 7.37
8 0.50 0.58 -28.68 0.47 -16.81 0.47 -16.71 -22.75 0.47 -16.61 0.64
9 0.75 0.47 -16.71 0.40 -4.53 0.42 -4.85 -10.62 0.42 -4.81 6.65
10 0.75 0.47 -16.71 0.42 -4.85 0.42 -4.84 -10.78 0.42 -4.81 0.17
11 1.00 0.42 -4.84 0.40 8.30 0.43 8.88 1.73 0.43 8.82 6.66
12 1.00 0.42 -4.84 0.43 8.88 0.43 8.90 2.02 0.43 8.82 0.29
13 1.25 0.43 8.90 0.47 26.33 0.51 28.24 17.62 0.51 28.13 7.86
14 1.25 0.43 8.90 0.51 28.24 0.52 28.46 18.57 0.51 28.13 0.89
15 1.50 0.52 28.46 0.65 50.52 0.72 53.37 39.49 0.73 53.70 9.76
16 1.50 0.52 28.46 0.72 53.37 0.73 53.77 40.92 0.73 53.70 1.46
17 1.50 0.52 28.46 0.73 53.77 0.73 53.83 41.12 0.73 53.70 0.21
18 1.75 0.73 53.83 1.08 71.64 1.22 73.68 62.74 1.31 74.70 11.74
19 1.75 0.73 53.83 1.22 73.68 1.24 73.95 63.75 1.31 74.70 1.76
20 1.75 0.73 53.83 1.24 73.95 1.24 73.99 63.89 1.31 74.70 0.25
21 2.00 1.24 0.00 1.24 0.00 1.24 0.00 0.00 1.31 74.70 0.00
>>
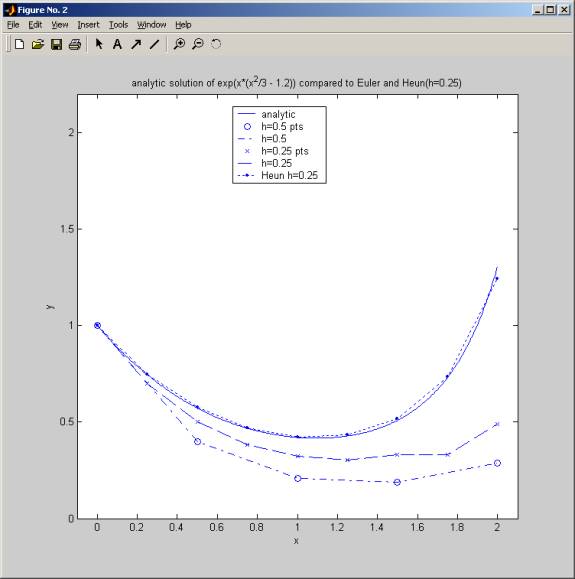
This below is a plot
to compare heun method with h=0.25 to Euler method for h=0.25 and h=0.25. It is
clear that heun method for h=0.25 does a much better job than Euler for same h.
function nma_euler_heun2(f,rate,stepSize,startX,endX,initialY,tol)
%function
nma_euler_heun2(f,rate,stepSize,initialX,finalX,tol)
%
% Function to solve ODE using Euler-Heun algorithm
(called
% als the corrector-predictor method.
%
%INPUT
% f: the
true solution. For debugging
%
% rate: A
string that represents the derivative dy/dx. This
% is the
function f(x,y) in the ODE equation dy/dx= f(x,y)
% This
string MUST use the letters 'x' and 'y' for the
%
independent and the dependent variables respectively.
% For an
example, in the equation dy/dx = y*x, the rate
% string is
passed in as 'y*x'
%
% stepSize:
This is 'h', the step size over x
%
% startX:
The starting value of x
%
endX: The ending value of x
% initialY:
Initial condition. The value of y at startX.
% tol: In
percentage. The value to stop the corrector-predictor
% loop
at each step.
%
%
% Author: Nasser Abbasi
FALSE = 0;
TRUE = 1;
%protect again predictor-correctpr loop not
converging
%to with epsilon.
MAX_STEPS_PER_ONE_ITERATION=1000;
y = initialY;
x = startX;
nStep = 0;
nPoints = (endX-startX)/stepSize +1;
currentPoint = 1;
while(currentPoint < nPoints)
converged = FALSE;
startStepX = x;
endStepX = x + stepSize;
startStepY = y;
rateStartOfStep = yder( rate, startStepX, startStepY );
y_predict = startStepY + (
stepSize * rateStartOfStep );
thisIterStep = 0;
while(~converged)
nStep =
nStep+1;
data.trueY(nStep) =
getTrueY(f,startStepX+stepSize);
data.trueRate(nStep) =
yder(rate,startStepX+stepSize,data.trueY(nStep));
data.startStepX(nStep) = startStepX;
data.startStepY(nStep) = startStepY;
data.startStepYRate(nStep) = yder( rate, startStepX, startStepY);
data.y_predict(nStep) =
y_predict;
rateEndOfStep = yder( rate, endStepX, y_predict );
data.rateAtyp(nStep) = rateEndOfStep;
averageRate = tan ( ( atan(rateStartOfStep) +
atan(rateEndOfStep) )/2 );
% averageRate = ( rateStartOfStep + rateEndOfStep )/2;
y_correct = startStepY + (
stepSize * averageRate );
data.rateAtyc(nStep) = yder( rate, endStepX, y_correct );
data.y_correct(nStep) = y_correct;
relativeError = abs( (y_correct - y_predict)/y_correct )*100;
data.relativeError(nStep) = relativeError;
data.averageRate(nStep) =
averageRate;
y_predict = y_correct;
thisIterStep = thisIterStep+1;
if(relativeError<tol | thisIterStep>MAX_STEPS_PER_ONE_ITERATION)
converged=TRUE;
end
end
% Update
for next point
x =
x+stepSize;
y =
y_correct;
currentPoint = currentPoint+1;
end
nStep
= nStep+1;
data.trueY(nStep)
= eval(f);
data.trueRate(nStep) =
yder(rate,x,data.trueY(nStep));
data.startStepX(nStep) = x;
data.startStepY(nStep) = y;
data.startStepYRate(nStep) = 0;
data.y_predict(nStep) = y;
data.y_correct(nStep) = y;
data.relativeError(nStep) = 0;
data.averageRate(nStep) = 0;
data.rateAtyp(nStep) = 0;
data.rateAtyc(nStep) = 0;
analyze(data,stepSize);
%%%%%%%%%%%%%
%
%
%%%%%%%%%%%%%%%
function v=getTrueY(f,x)
v=eval(f);
%%%%%%%%%%%%%%%%%%%%
%
%
%%%%%%%%%%%%%%%%%%%%
function dydx=yder(f,x,y)
dydx=eval(f);
%%%%%%%%%%%%%%%%%%%%%%%
%
%
%
%%%%%%%%%%%%%%%%%%%%%%
function analyze(d,stepSize)
row=length(d.startStepX);
fprintf('n\t x\t\t y0\t\t y0''\t yp\t yp''\t yc\t\t y_c''\t y_av''\t yt\t\t
y''_t\t err(a)\n');
for(i=1:row)
fprintf('%d\t',i);
fprintf('%4.2f\t',d.startStepX(i));
fprintf('%4.2f\t',d.startStepY(i));
fprintf('%4.2f\t',atan(d.startStepYRate(i))*180/pi);
fprintf('%4.2f\t',d.y_predict(i));
fprintf('%4.2f\t',atan(d.rateAtyp(i))*180/pi);
fprintf('%4.2f\t',d.y_correct(i));
fprintf('%4.2f\t',atan(d.rateAtyc(i))*180/pi);
fprintf('%4.2f\t',atan(d.averageRate(i))*180/pi);
fprintf('%4.2f\t',d.trueY(i));
fprintf('%4.2f\t',atan(d.trueRate(i))*180/pi );
fprintf('%4.2f\t',d.relativeError(i));
fprintf('\n');
if(i<row)
if(d.startStepX(i+1) ~= d.startStepX(i))
fprintf('\n');
end
end
end
d=removeDuplicateEntries(d);
plotAnalyticAndHeunOnly(d,stepSize);
figure;
x_5=[0 0.5 1 1.5 2];
y_5=[1 0.4 0.21 0.189 0.288225];
x_25=[0 0.25 0.5 0.75 1 1.25 1.5 1.75 2];
y_25=[1 0.7
0.5009375 0.38196484375 0.321089196777344 ...
0.305034736938477
0.332678509973526
0.332678509973526 0.487581941179949];
y_analytic='exp(x*(x^2/3 - 1.2))';
ezplot(y_analytic,0,2);
hold on;
plot(x_5,y_5,'o')
plot(x_5,y_5,'-.')
plot(x_25,y_25,'x')
plot(x_25,y_25,'--')
plot(d.startStepX(:),d.startStepY(:),'.:')
xlim([-0.1 2.1]);
ylim([0 2.2])
legend('analytic','h=0.5 pts','h=0.5','h=0.25
pts','h=0.25','Heun h=0.25');
ylabel('y');
title(sprintf('analytic solution of %s compared to
Euler and Heun(h=%.2f)',y_analytic,stepSize));
%%%%%%%%%%%%%%%%%%%%
%
%
%%%%%%%%%%%%%%%%%%%%%%%%
function plotAnalyticAndHeunOnly(d,stepSize)
figure;
y_analytic='exp(x*(x^2/3 - 1.2))';
ezplot(y_analytic,0,2);
hold on;
plot(d.startStepX(:),d.startStepY(:),'.:')
xlim([-0.1 2.1]);
ylim([0 2.2])
legend('analytic','Heun h=0.25');
ylabel('y');
title(sprintf('analytic solution of %s compared to
Heun(h=%.2f)',y_analytic,stepSize));
%%%%%%%%%%%%%%%%%%%%%%%%%%%%
%
%
%%%%%%%%%%%%%%%%%%%%%%%%%%%%%
function v=removeDuplicateEntries(d)
n=length(d.relativeError);
j=0;
for(i=1:n)
if(i<n)
if(d.startStepX(i+1) ~= d.startStepX(i) )
j=j+1;
v.startStepX(j)=d.startStepX(i);
v.startStepY(j)=d.startStepY(i);
end
else
j=j+1;
v.startStepX(j)=d.startStepX(i);
v.startStepY(j)=d.startStepY(i);
end
end