Here is some code for a nice "Honey Comb" mesh composed of equilateral triangles:

Calculate the x, y coordinates of the nodes :

In[1]:=

nx = 7 ; ny = 5 ; dx = 1./(nx - 2) ;

nodes = Flatten[Table[Table[Chop[{Min[1, Max[-1, x]], dx (j - 0.5 (ny + 1))/Tan[π/6]}], {x, -(1 + dx Mod[j, 2]), 1 + dx, 2dx}], {j, 1, ny}], 1]

Out[2]=

$DefaultFont = {"Times-Roman", 9} ; ListPlot[nodes, PlotStyle→ {PointSize[dx/2]}, PlotRange→All, AspectRatio→Automatic] ;

[Graphics:HTMLFiles/index_6.gif]

Calculate the indices of nodes of the triangle elements :

In[3]:=

Out[3]=

Here is a picture to visualize the triangle elements :

In[4]:=

jmax = Length[elements] ; PlotColor[hue_] := Hue[2 (1 - hue)/3] ;

[Graphics:HTMLFiles/index_13.gif]

If you want to use this mesh in Fortran or some other program, you can use this code to export the mesh :

In[6]:=

Export["C:/nodes.txt", Chop[nodes], "Table"] ; Export["C:/elements.txt", Chop[elements], "Table"] ;

In[7]:=

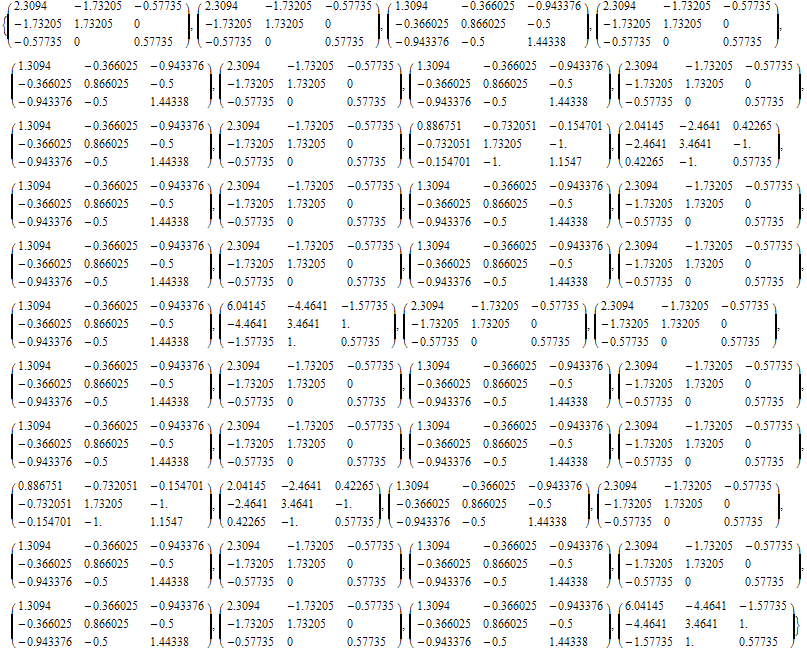
Map[MatrixForm, Klocal]

General :: spell1 : Possible spelling error: new symbol name \"Δy\" is similar to existing symbol \"Δx\".  More…

Out[8]=

Assemble global stiffness matrix :

In[9]:=

nxy = Length[nodes] ; Kglobal = Table[0, {nxy}, {nxy}] ;

Do[element = elements[[j]] ; Do[Kglobal[[element[[m]], element[[n]]]] += Klocal[[j, m, n]], {m, 1, 3}, {n, 1, 3}], {j, 1, jmax}] ;

Kglobal//MatrixForm

General :: spell : Possible spelling error: new symbol name \"element\" is similar to existing symbols  {Element, elements} .  More…

Out[11]//MatrixForm=

Calculate the load vector :

In[12]:=

Q = Table[1, {nxy}] ;

Modify the global stiffness matrix and load vector to include boundary conditions :

In[13]:=

Do[{x, y} = nodes[[i]] ; If[Abs[x] == 1 || Abs[y] == 0.5dx (ny - 1)/Tan[π/6], Kglobal[[i]] = Table[If[j == i, 1, 0], {j, 1, nxy}] ; Q[[i]] = 0], {i, 1, nxy}] ;

Kglobal//MatrixForm

Out[14]//MatrixForm=

Solve for Prandtl stress function :

In[15]:=

q = Chop[LinearSolve[Kglobal, Q]]

Out[15]=

{0, 0, 0, 0, 0, 0, 0, 0, 0.312802, 0.374756, 0.370526, 0.296165, 0, 0, 0.203826, 0.455993, 0.502991, 0.472738, 0.297062, 0, 0, 0.263393, 0.36375, 0.377434, 0.330553, 0, 0, 0, 0, 0, 0, 0, 0}

Here is the same code again, this time using a finer mesh :

In[16]:=

nx = 50 ; ny = Round[2 (nx - 2) Tan[π/6] + 1] ; dx = 1./(nx - 2) ;

nodes = Flatten[Table[Table[{Min[1, Max[-1, x]], dx (j - 0.5 (ny + 1))/Tan[π/6]}, {x, -(1 + dx Mod[j, 2]), 1 + dx, 2dx}], {j, 1, ny}], 1] ;

Do[element = elements[[j]] ; Do[Kglobal[[element[[m]], element[[n]]]] += Klocal[[j, m, n]], {m, 1, 3}, {n, 1, 3}], {j, 1, jmax}] ; Q = Table[1, {nxy}] ;

Do[{x, y} = nodes[[i]] ; If[Abs[x] == 1 || Abs[y] == 0.5dx (ny - 1)/Tan[π/6], Kglobal[[i]] = Table[If[j == i, 1, 0], {j, 1, nxy}] ; Q[[i]] = 0], {i, 1, nxy}] ;

q = LinearSolve[Kglobal, Q] ; q1 = Min[q] ; q2 = Max[q] ; PlotColor[hue_] := Hue[2 (1 - hue)/3] ;

Show[Graphics[{PointSize[1.5dx], Table[{PlotColor[(q[[i]] - q1)/(q2 - q1)], Point[nodes[[i]]]}, {i, 1, nxy}]}, AspectRatio→Automatic, Background→RGBColor[0, 0, 0]]] ;

[Graphics:HTMLFiles/index_46.gif]


Created by Mathematica  (May 16, 2006) Valid XHTML 1.1!