Feature Extraction Techniques on DNA Microarray Data FOR Cancer
Detection
Charles h. lee & Nasser AbbAsi
Department of
Mathematics,
Abstract—Recent advances in microarray technology offer the ability to study the expression of thousands of genes simultaneously. The DNA data stored on these microarray chips can provide crucial information for early clinical cancer diagnosis. The Principal Orthogonal Decomposition (POD) method has been widely used as an effective feature detection method. In this paper, we present an enhancement to the standard approach of using the POD technique as a disease detection tool. In the standard POD method, cancer diagnosis of an arbitrary sample is based on its correlation value with the cancerous signature, attained by extracting from the DNA microarray data which are known to be primary malignant tumor. Our improvement in cancer detection is motivated by the idea of maximizing signal to noise ratio in signal enhancement. Namely, the diagnosis is based not only on how closely a given sample resembles the cancer signature, but also how far away it is from being cancer-free and vice versa. We applied these improvements to the detection of primary bladder and liver cancer. Our findings indicate that this enhancement in how the POD is used leads to a higher accuracy for the detection of cancer, especially in the false negative cases.
INTRODUCTION
Our approach is to apply a pattern recognition technique, called the Principal Orthogonal Decomposition (POD), to extract the characteristics of a disease from an ensemble of samples known to carry the disease and to use the extracted feature for disease detection. Such practice is quite common and in fact we have implemented this feature extraction approach with the Principal Component Analysis [4, 5] and the Independent Component Analysis [6] methods in detecting cancers. In this paper, we present an enhanced approach to the standard Principal Orthogonal Decomposition (POD) technique in cancer detection. In contrast to the previous studies, we also extract the encrypted signatures of the non-cancer samples. This additional aspect enables our approach to diagnose more accurately if a sample is cancer or cancer-free. In particular, the diagnosis is based not only on how closely a given sample resembles the cancer signature, but also how far away it is from being cancer-free one and vice versa. Studies based on the liver and bladder cancer data sets along with the performances of the enhanced algorithms are presented. Our findings indicate that the enhanced approach to the POD provides a more accurate tool for detecting cancer and that our approach can be a promising tool for clinical detecting of cancer as well as other diseases.
POD IN CANCER DETECTION & ITS ENHANCED APPROACH
Let ![]() be the POD representatives extracted from the ensemble of DNA
microarray samples
be the POD representatives extracted from the ensemble of DNA
microarray samples![]() (see [3-5] for detailed analysis). We denote by
(see [3-5] for detailed analysis). We denote by ![]() the inner product,
then the POD modes satisfy
the inner product,
then the POD modes satisfy ![]() , which is equivalent to saying that the first few POD modes
are the dominant and resemble most the original sample set. If
, which is equivalent to saying that the first few POD modes
are the dominant and resemble most the original sample set. If ![]() is a sample to be tested, then
is a sample to be tested, then ![]() , its projection onto the first
, its projection onto the first ![]() modes, provides a simple metric in
determining whether
modes, provides a simple metric in
determining whether ![]() belongs the original sample set
belongs the original sample set![]() . In our previous studies [4, 5],
. In our previous studies [4, 5], ![]() are samples known to
be primary malignant tumor. In this paper, we consider the primary malignant
tumor samples
are samples known to
be primary malignant tumor. In this paper, we consider the primary malignant
tumor samples ![]() as well as samples known to be cancer-free
as well as samples known to be cancer-free ![]() . It is the extra
degree of freedom from the cancer-free gene expression that improves the
detection over the standard POD method. When applying the POD method to the two
sample sets, we obtain the representatives
. It is the extra
degree of freedom from the cancer-free gene expression that improves the
detection over the standard POD method. When applying the POD method to the two
sample sets, we obtain the representatives ![]() and
and ![]() . Thus the projections of an arbitrary sample
. Thus the projections of an arbitrary sample ![]() onto the first
onto the first ![]() POD tumorous and
cancer-free modes are
POD tumorous and
cancer-free modes are ![]() and
and ![]() , respectively. The following three algorithms will be
implemented to diagnose an arbitrary sample
, respectively. The following three algorithms will be
implemented to diagnose an arbitrary sample![]() :
:
1.
Tumor Projection: if ![]() , then
, then ![]() is tumorous; otherwise, it is cancer-free.
is tumorous; otherwise, it is cancer-free.
2.
Cancer-free Projection:
if ![]() , then
, then ![]() is cancer-free; otherwise, it is tumorous.
is cancer-free; otherwise, it is tumorous.
3.
Combination Projection: if ![]() or
or ![]() >
>![]() , then
, then ![]() is tumorous; otherwise if
is tumorous; otherwise if ![]() , then
, then ![]() is cancer-free; else this test is inconclusive.
is cancer-free; else this test is inconclusive.
Figure 1 below illustrates the high level design of the above algorithms. The first two algorithms are commonly practiced and we have implemented Algorithm 1 in [4-6]. Algorithm 3 takes into consideration both the tumor and cancer-free projections. In some sense, it favors the tumor result over the cancer-free because it is better for the diagnosis to be false positive rather than false negative. The accuracy and robustness of these algorithms will be presented in the next section.
DNA MICROARRAY SAMPLES & CANCER DETECTION RESULTS
As an application of the POD method, we examined DNA microarray data from references [1] and [2]. The data were obtained from the Stanford Microarray Database at genome-www5.stanford.edu.
The primary POD modes were determined using a random selection of the samples. Projections onto the POD modes were performed for all the cancerous and the cancer-free tissue samples. We then compare the projections of these samples using the algorithms discussed in the previous section.
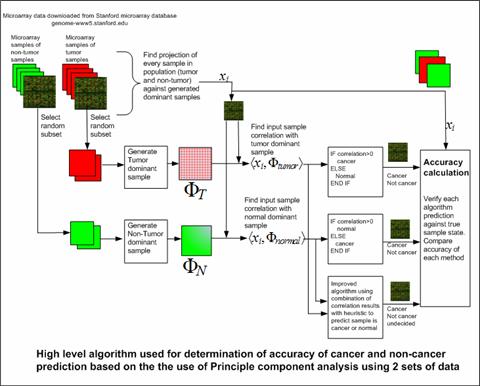
Figure 1: High-level cancer detection approach and diagnosis algorithms
Based on the observations of the projections, we find that cancerous samples do not correlate positively as strongly with the cancerous dominant component when compared to how strongly the cancer-free samples negatively correlate with the cancerous dominant component. Cancerous samples correlate much strongly, but in the negative sense, with the cancer-free dominant component. Hence, when attempting to decide if a sample is cancerous or not, it is not recommend to measure the strength of the positive correlation with the cancerous dominant component, but instead one should measure the strength of how negatively the sample correlates with the cancer-free dominant component. The situation with cancer-free samples is different. Cancer-free samples do correlate very strongly in the positive sense with the cancer-free dominant principle component.
Cancer-free samples also correlate very strongly in the negative direction with the cancerous dominant component. From the above, we conclude that it is best to always correlate the sample to be examined with the cancer-free dominant component since a cancer-free sample will exhibit a strong positive correlation while at the same time a cancerous sample would exhibit a strong correlation but in the negative sense. In other words, both types of samples have stronger correlations with the cancer-free dominant component when looking at the absolute magnitude of the correlation than the case would be if we had used a cancerous dominant component.
The third algorithm introduces a heuristic algorithmic improvement in the detection of cancer. As a result of this improvement, we were able to improve cancer detection. However, since this improvement in detection is based on a heuristic improvement, more tests are needed against larger set of data.
Table 1: Accuracy for the diagnosis algorithms for liver and bladder cancers
|
Data set |
Accuracy of detection of |
Algorithm |
One mode |
Two modes |
Three modes |
Four modes |
Five modes |
|
Liver |
Cancer |
1 |
69.46 |
82.74 |
80.58 |
80.37 |
78.07 |
|
2 |
81.47 |
78.44 |
81.30 |
82.61 |
80.96 |
||
|
3 |
80.75 |
88.54 |
87.15 |
89.82 |
89.54 |
||
|
|
1 |
99.99 |
98.91 |
99.51 |
99.21 |
99.63 |
|
|
2 |
100.00 |
96.41 |
95.11 |
93.28 |
90.68 |
||
|
3 |
99.99 |
98.72 |
98.54 |
98.44 |
98.94 |
||
|
Bladder |
Cancer |
1 |
57.17 |
62.15 |
64.83 |
68.11 |
70.51 |
|
2 |
80.35 |
77.35 |
73.20 |
69.23 |
70.26 |
||
|
3 |
82.35 |
82.97 |
83.30 |
83.81 |
84.25 |
||
|
|
1 |
99.95 |
99.32 |
99.86 |
99.95 |
100.00 |
|
|
2 |
100.00 |
99.50 |
94.32 |
93.59 |
91.59 |
||
|
3 |
99.82 |
99.41 |
99.71 |
99.81 |
100.00 |
CONCLUSIONS
Examining the correlation of an arbitrary tissue sample with the POD dominant component sample generated from the cancer-free samples produces more accurate results for both cancer and cancer-free detection
An algorithmic improvement that considers the correlation of a sample against both POD modes was implemented and was shown to produce more accurate diagnostic results.
REFERENCES
[1] Chen, X., et. al., “Variation in Gene Expression Patterns in Human Liver Cancers”, Mol Biol Cell. 2002 Jun; 13(6): 1929-39.
[2] Chen, X., et. al., “Variation in Gene Expression Patterns in Human Gastric Cancers”, Mol Biol Cell. 2003 Aug; 14(8): 3208-15. Epub 2003 Apr 17.
[3] H.V. Ly and H.T. Tran, “Modeling and Control of Physical Processes using Proper Orthogonal Decomposition,” Computers and Mathematics with Applications, vol. 33 (2001) pp. 223-236.
[4] D. Peterson and C. H. Lee,
"Disease Detection Technique Using the Principal Orthogonal Decomposition
on DNA Microarray Data" Proceedings of the 6th Nordic Signal Processing
Symposium, NORSIG 2004,
[5] C. H. Lee and D. Peterson, "A DNA-based pattern recognition technique for cancer detection" Proceedings of the 26th Annual Conference of the IEEE Engineering in Medicine and Biology Society, Vol. 2 (2004) pp. 2956-2959.
[6] C.H. Lee and M.
Vodhanel, "Cancer detection using component analysis methods on DNA
microarrays" Proceedings of the 12th Int. Conf. on Biomedical Engineering
(2005),